How Flooding Affects Real Estate
The financial damage starts when the water recedes.
- Property damage — structural destruction, mold, long-term deterioration
- Asset devaluation — flood-exposed properties sell at growing discounts
- Operational disruption — tenant displacement, business interruption, lost rent
- Insurance cost spiral — premiums rising 10–25% annually in exposed areas
- Mitigation costs — flood barriers, elevation, drainage upgrades, and remediation
- Uninsurability — repeated claims make properties unmortgageable
- Massive coverage gap — 70% of U.S. flood losses (roughly $17B a year) are uninsured
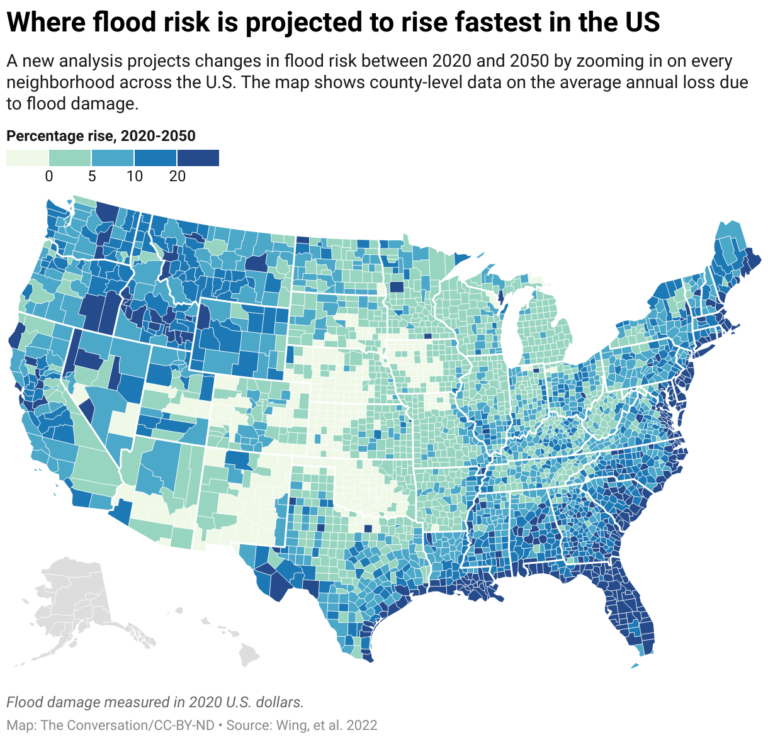
Location Is Everything
Flood risk is not evenly distributed — and it's shifting. This map shows where flood damage is projected to increase fastest over the next 30 years. Two real estate investment trusts (REITs) in the same sector can face completely different economics depending on where their properties sit.
That location-specific repricing is already underway in insurance markets. The question is whether it's reflected in the REITs and funds you own.
How Flooding Works — and Why It's Getting Worse
Flooding is simple: more water than the land or drains can handle. But it comes in three forms, and each one is getting worse.
- Riverine flooding — rivers overflow after heavy rain, sometimes reaching communities miles from where the rain fell.
- Flash flooding — extreme rainfall in minutes, in areas with poor drainage. Cars get swept away before warnings arrive.
- Coastal flooding — storm surge, high tides, and rising seas reach neighborhoods that have never flooded before.
All three are getting worse for the same reason: a warmer atmosphere holds more moisture. Storms deliver more rain than they used to, and cities built for old rainfall patterns can't keep up. The American Society of Civil Engineers gave U.S. stormwater infrastructure a D grade in 2021.
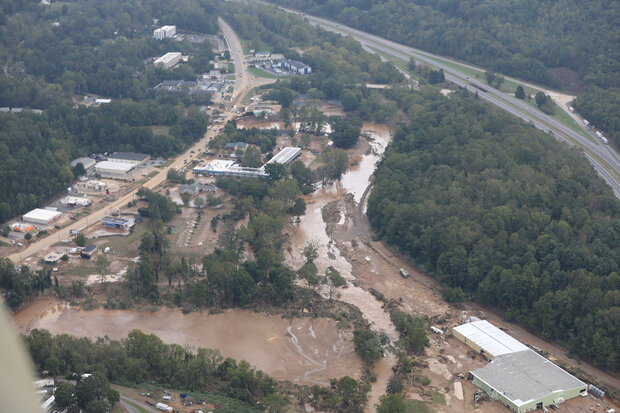
Where Flooding Is Redefining Real Estate
The Gulf Coast and Southeast remain the most flood-exposed region in the country. Hurricane Harvey (2017) dropped 60 inches of rain on Houston over five days, generating $125 billion in losses — much of it uninsured, because huge parts of the city sat outside FEMA's official flood zones. Homeowners had no warning and no coverage.
The Northeast is a more recent story. Hurricane Ida (2021) killed more people from inland flooding in New York and New Jersey than it did along the Gulf Coast where it made landfall. Basement apartments flooded in minutes. Subway tunnels filled with water. The storm exposed how unprepared dense northeastern cities are for extreme rain.
The FEMA Map Problem
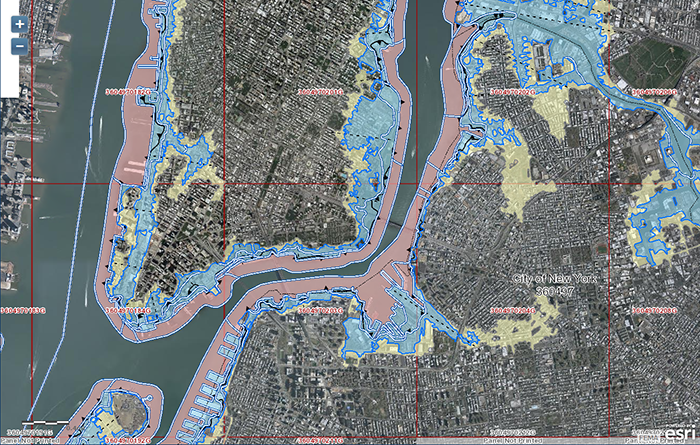
What the Maps Actually Say
FEMA's flood maps divide the country into zones. Properties in "A" or "V" zones (high risk) are required to carry flood insurance if they have a federally-backed mortgage. Everyone else is considered low- or moderate-risk — and most of them don't buy coverage.
But those lines were drawn using historical rainfall. Climate change has already made them obsolete.
Here's what most homeowners don't know: FEMA's flood maps cover less than half the country, and in many places they are decades out of date.
First Street Foundation estimates that 14.6 million U.S. properties face substantial flood risk today, compared to the 8.7 million FEMA's maps identify. That's nearly 6 million properties whose owners have no idea they're at risk — and no flood insurance to show for it.
The federal National Flood Insurance Program is currently more than $20 billion in debt to the U.S. Treasury, built up through years of underpriced policies. FEMA's 2021 Risk Rating 2.0 overhaul started repricing flood insurance to reflect actual property-level risk — and premiums in many areas are rising sharply as a result.
What Insurers Already Know
The insurance industry has been pricing flood risk for decades using catastrophe models — physics-based simulations calibrated against actual claims data. Those models show flood losses growing 5–7% annually through 2040. Private flood insurers are entering the U.S. market at three to five times the rates charged by the federal program.
Insurance math, not politics
Insurers price flood risk based on expected losses from catastrophe models, not beliefs about climate policy. When premiums spike or coverage disappears, it's a balance-sheet decision. The claims data is clear: flooding is getting worse, and most property owners aren't covered.
Why This Matters
REITs — real estate investment trusts — own physical buildings in specific locations. A coastal industrial REIT faces completely different flood economics than an inland data center REIT. That's the property-level problem: where a building sits shapes what it's worth.
But portfolios have a second problem. When a REIT owns hundreds of buildings, many of them can share the same flood risk without anyone noticing. One bad Gulf Coast storm doesn't hit one property — it can damage dozens of buildings in the same portfolio at once. That's called correlated risk: bets that look different but move together when the water rises.
The index underlying VNQ, and most other U.S. real estate funds, weights REITs purely by market capitalization. It doesn't look at how much of a REIT's portfolio sits in the same flood zone, or how many REITs in the index are exposed to the same coastline.
The CLIMX index is built differently. It uses the same catastrophe models insurers use — applied building by building across every REIT — and measures how much of a fund's exposure clusters on the same risk. Insurance markets are already repricing flood risk in real time. Market-cap indexes haven't caught up.
The First Real Estate Index Built on Insurance-Grade Climate Models
We use the same catastrophe models insurers use to price flood risk — at the property and portfolio level — to build a real estate index with climate risk priced in.